Writing reports can often feel like a tedious task. We've all been there – staring at a blank page, struggling to find the right words to convey our message. But reporting is important and can be interesting if done the right way.
How to structure a good report
Start with a summary of what really counts. Then move on to progress towards outcomes. Finally, describe what your organisation delivered: outputs.
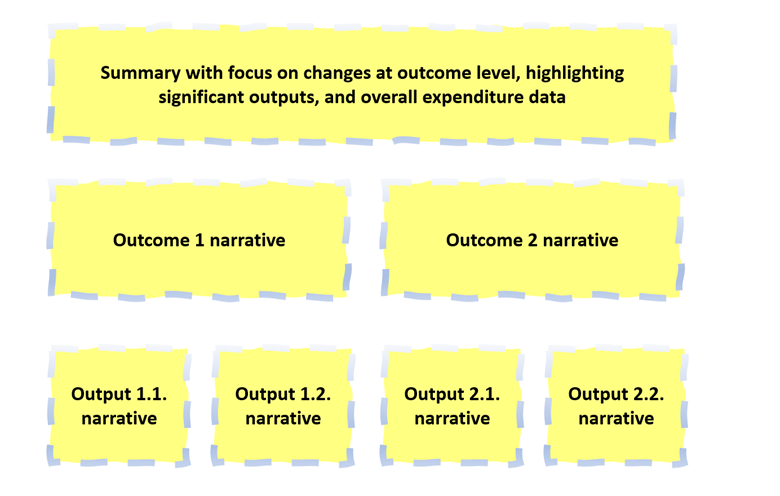
STEP 1: Sum up what really counts
Begin with a summary that puts the focus on changes at a level that truly counts – the outcome level. Highlight significant outputs and include overall expenditure data.
STEP 2: Move on to outcomes
For each outcome, describe the progress your organisation has achieved. Use outcome indicator data as well as other data from external sources.
STEP 3: Finally, describe outputs
Describe for each output what your organisation has delivered in the reporting period. Use data from indicators and external data where available.
How to write a stellar output description
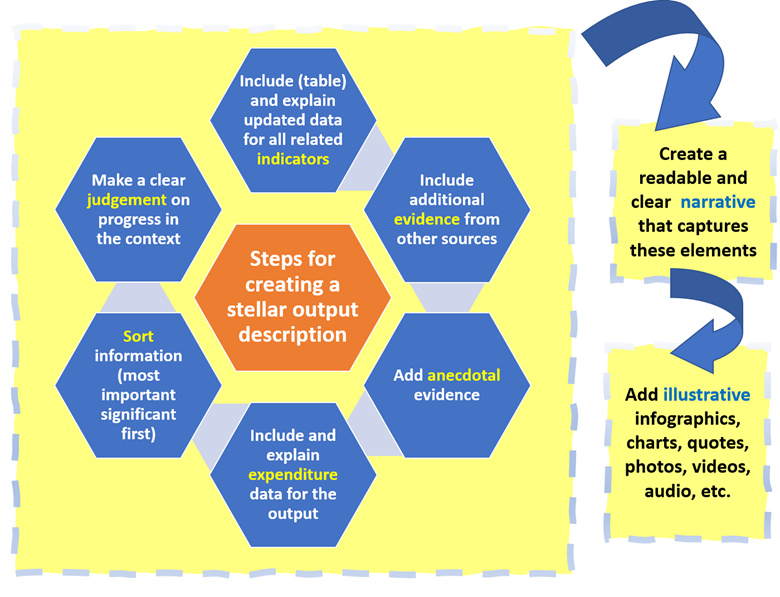
STEP 1. Present updated data for all related indicators
Begin by showcasing the most up-to-date data for all indicators related to the output.
STEP 2. Incorporate additional evidence from other sources
Do not rely solely on indicator data. Include evidence from reports by independent evaluators or feedback from stakeholders.
STEP 3. Supplement with anecdotal evidence
Anecdotal evidence can provide valuable insights into the progress being made. Include quotes from participants about the impact of the programme.
STEP 4. Provide expenditure data
Include a breakdown of how much was spent and explain what it means in terms of results achieved.
STEP 5. Organise information (most important first)
Arrange your report logically, with the most important information presented first.
STEP 6. Make a clear judgement on progress
Make a clear judgement on the progress your organisation has made in the context of the overall programme.
STEP 7. Craft a readable and clear narrative
Ensure your report is easy to read. Use headings and subheadings and change language.
STEP 8. Enhance with infographics, charts, photos
Use visual aids to help convey information in an engaging way.
Want to learn more? Check out the video course on Practical Results Based Management on Udemy.